 evandus
User Guide
This platform is aiming to achieve simple and low maintenance fitness tracking with both desktop and mobile version available. Below are key areas that can help maintain your fitness goals.Short Term Tracking
Use the home screen to track your daily 'load' and be guided on when to go easy or hard on your next activity.
One measure to use is a comparison of the average 3 and 7 day load. When you average more for 3 vs 7 days you are classified as 'Tired'. This is just something to guide you on a day to day basis, not a real scientific approach!
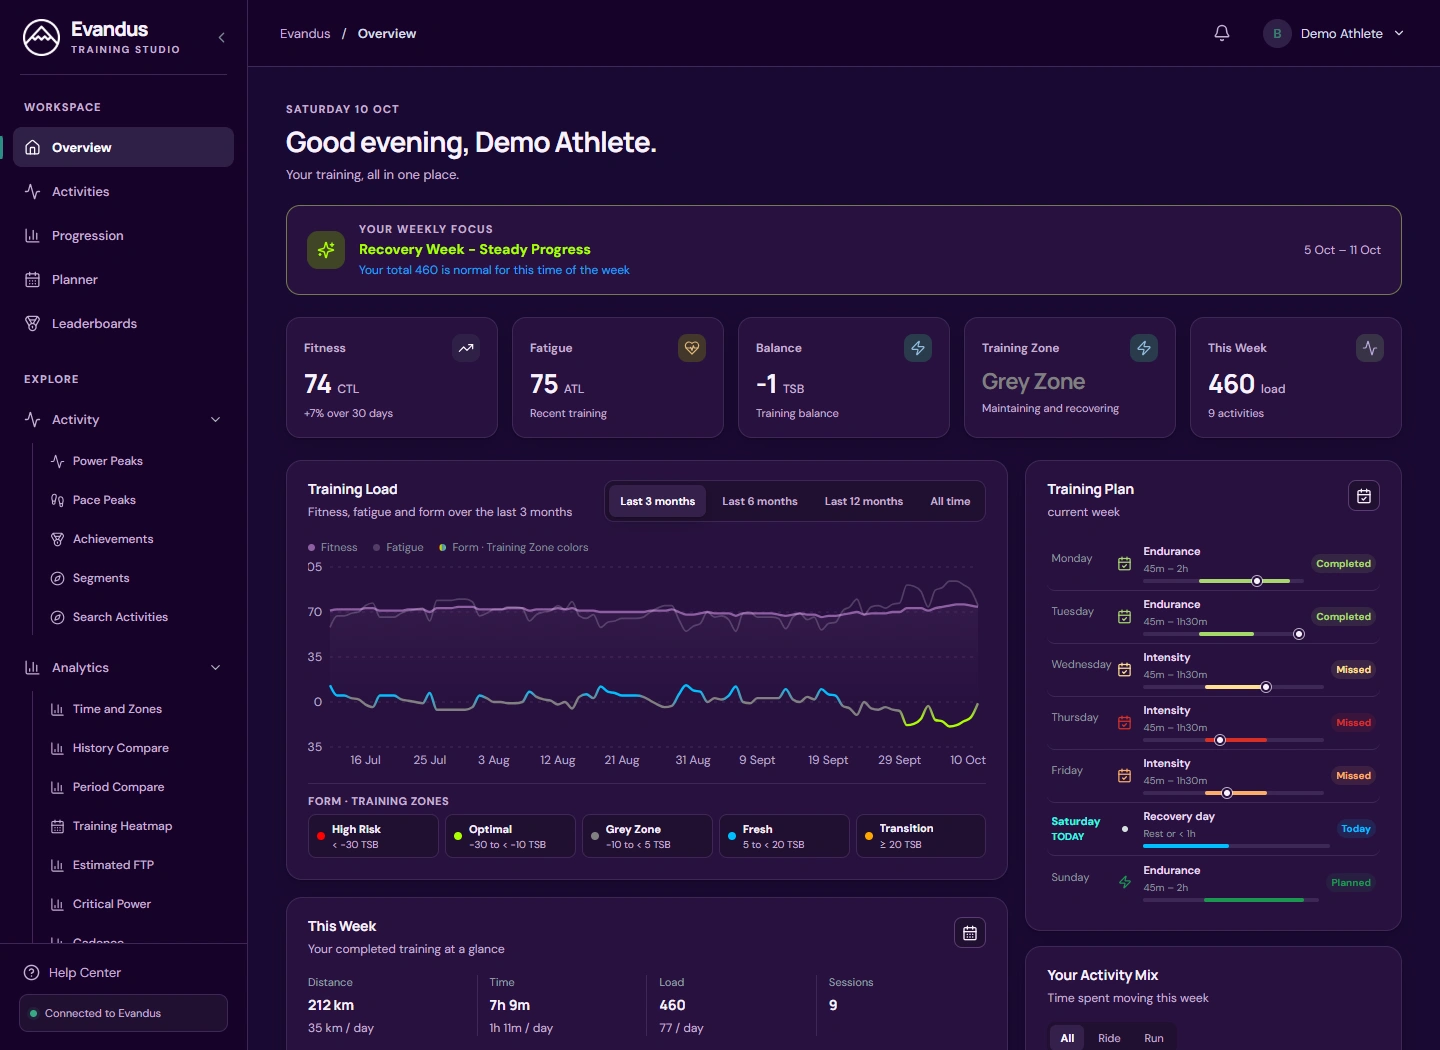
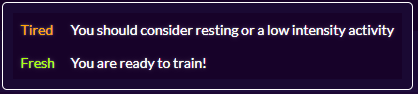
The daily load graph wil also help you tracking the last seven days from various angles. In the 'Load' view the color of the bar will display overall intensity recorded for your activities, red for high, green for low. A mix of both is normally best. Summary text will also inform you of progress compared to recent weeks.
A 'Time in Zone' breakdown is also available for power for cycling, pace for running. Select either ride or run first, then the pace or power button. You typically would want some days that you are mostly green/yellow to rest and others colored with a series of orange/reds.
Long Term Tracking
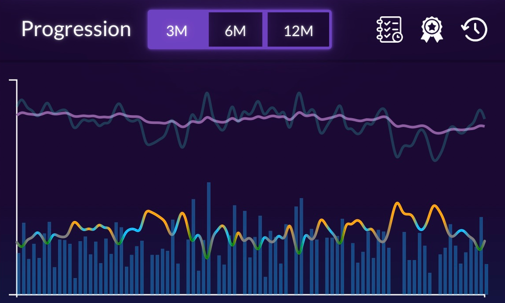
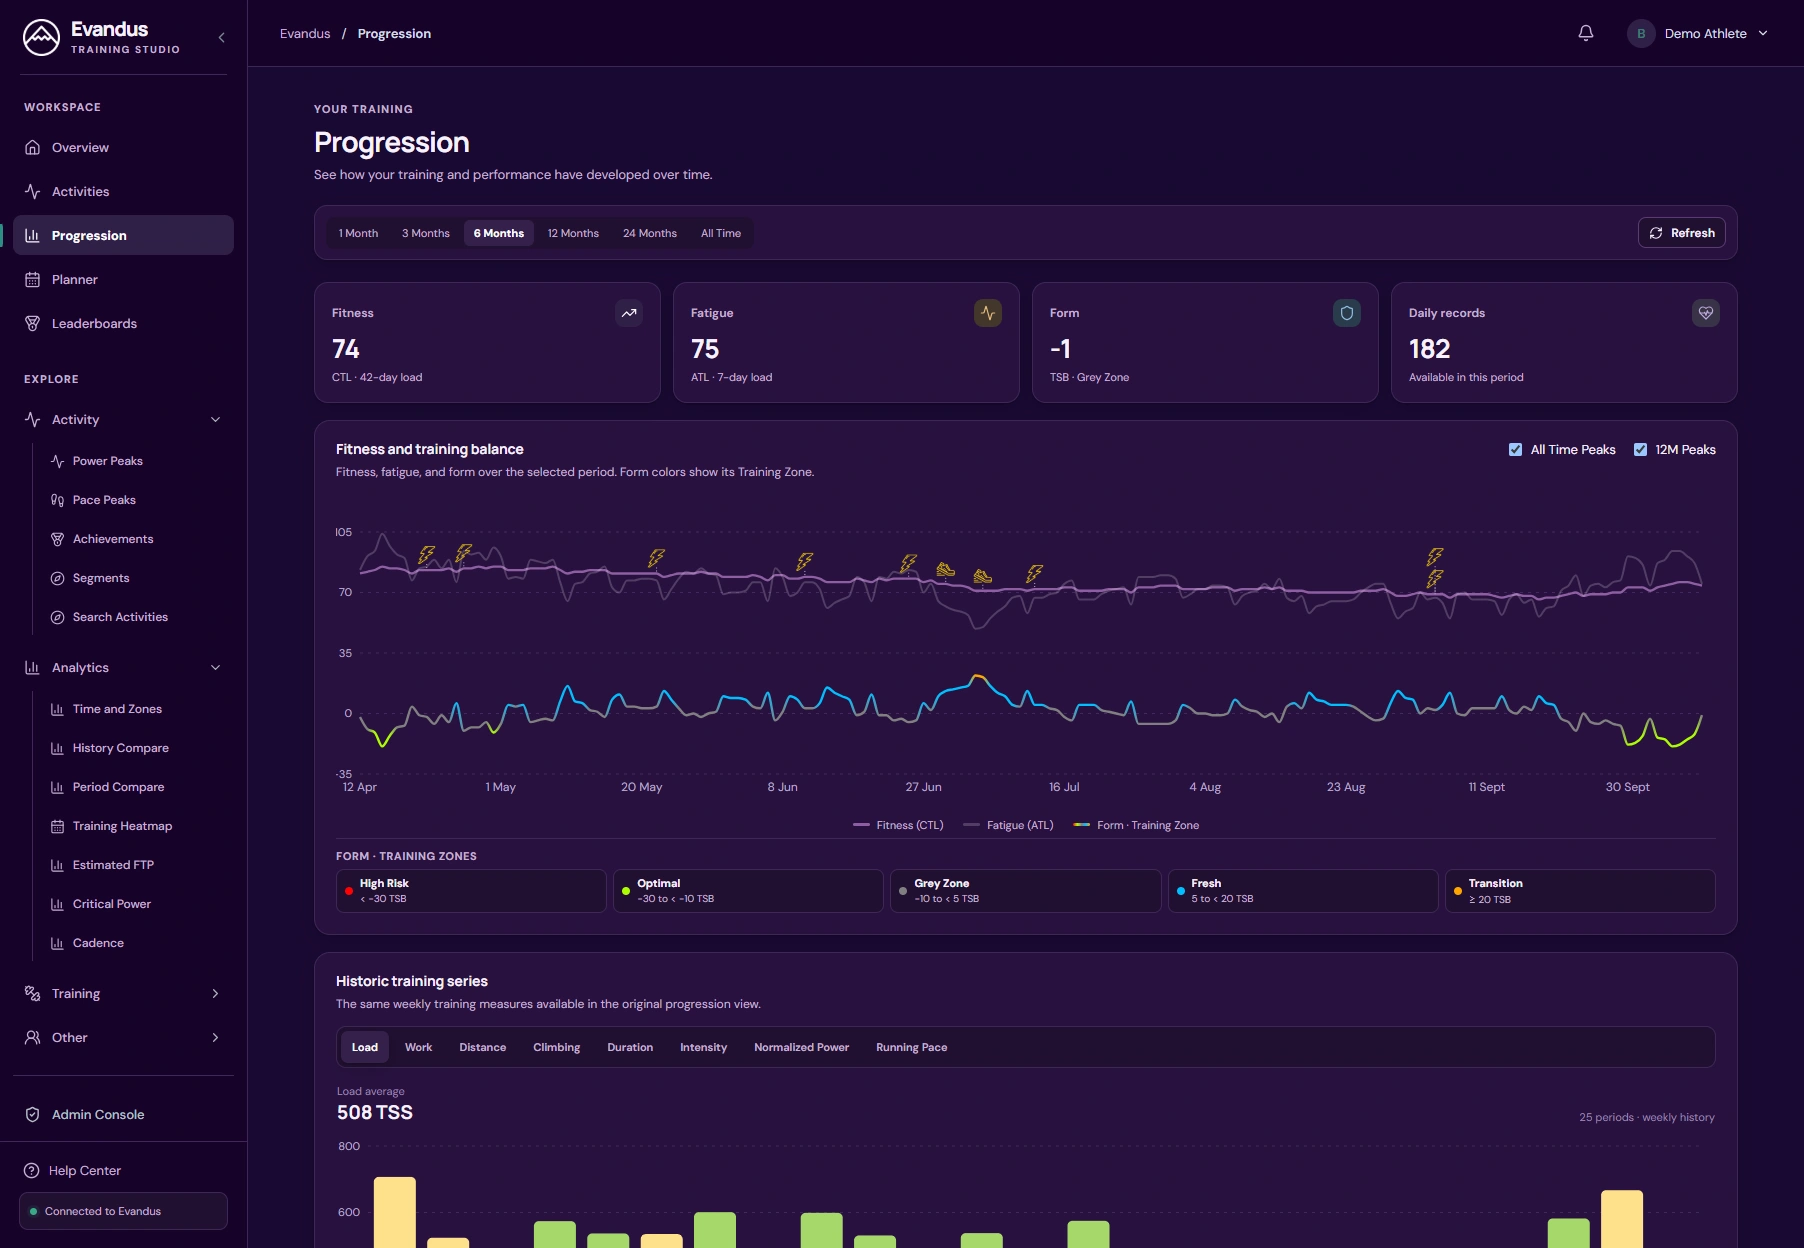
For a longer term view on fitness see the “Progression” chart. This is a PMC chart that displays a 42 day moving average of 'Fitness' (purple), a 7 day moving average of 'Fatigue' (light blue) and a colorful 'Balance' line that is the difference between these 2 numbers. This 'Balance' line will change colors from orange to red to illustrate a 'Training Zone' you are currently in.
The general rule is to try and stay around the 'Optimal' training status, but you will typically bounce
between a number of colors.
As you increase fitness the purple line should increase but it should also come down as you periodize your training blocks (rest weeks,etc). Having a high fitness number is not always best, a wise coach would say performance is the only true measure of fitness!
Desktop:
Peaks Tracking
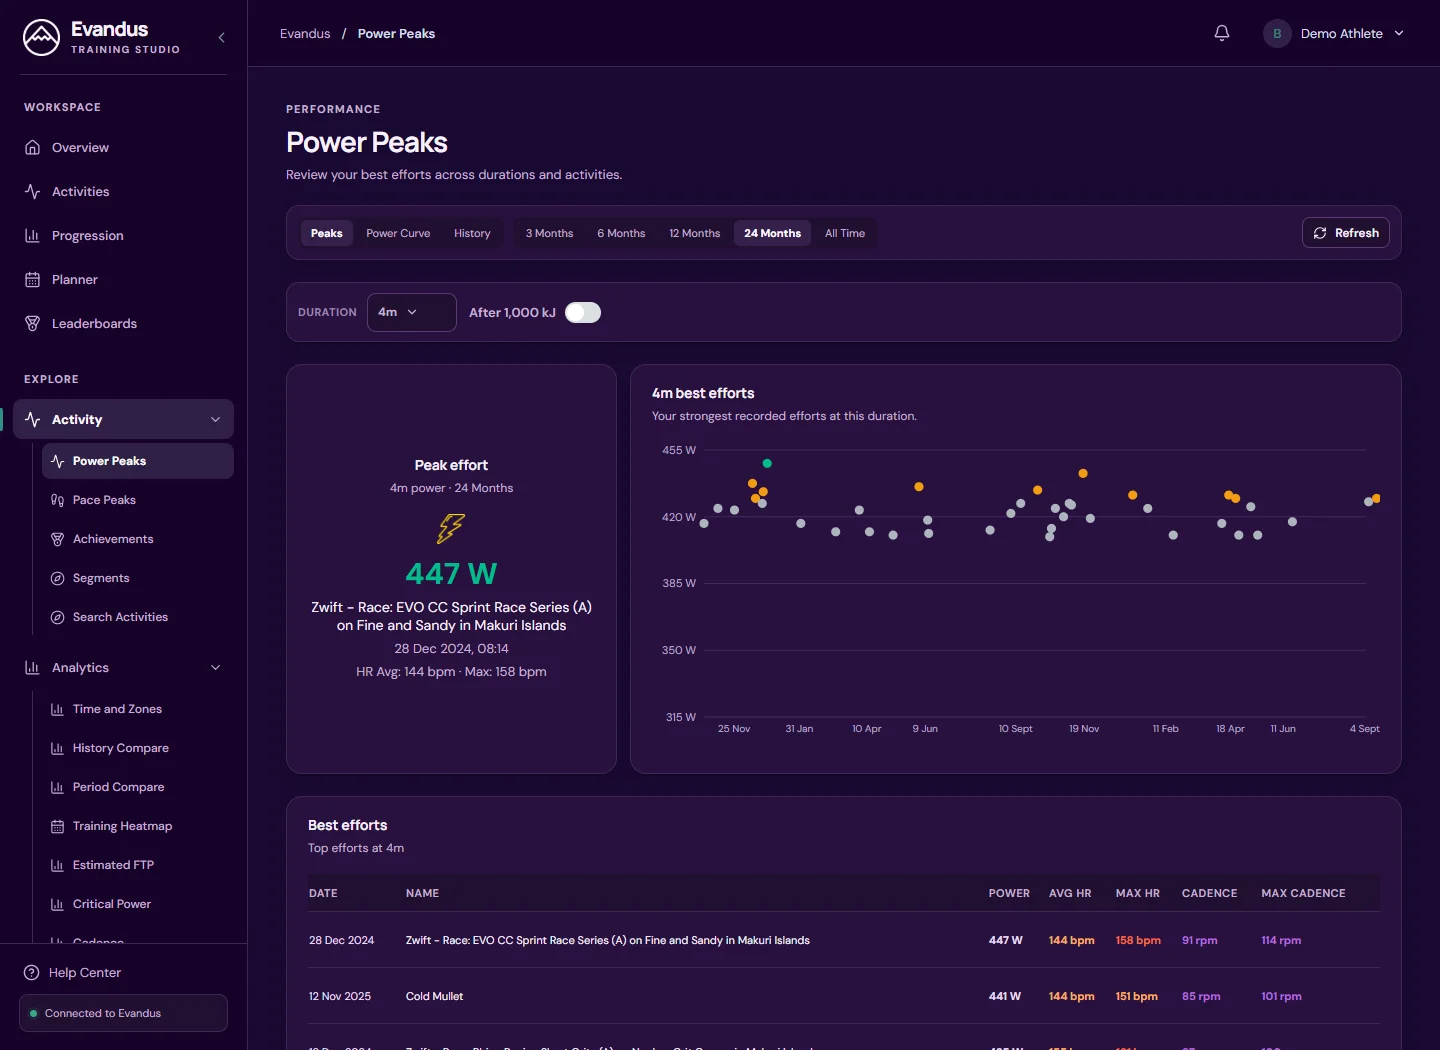
Use the 'Peaks' command to see your best recorded efforts for Power / Pace across various intervals / time ranges. The chart will show your changes over time.
Curve Based Tracking
Use the 'Peaks' -> 'Curves' view to see your best recorded efforts for Power / Pace across various intervals / time ranges.
Achievement Tracking
To see a log of your recent performance achievements see the button:
or the achievements command.Calendar Tracking and Forward Planning
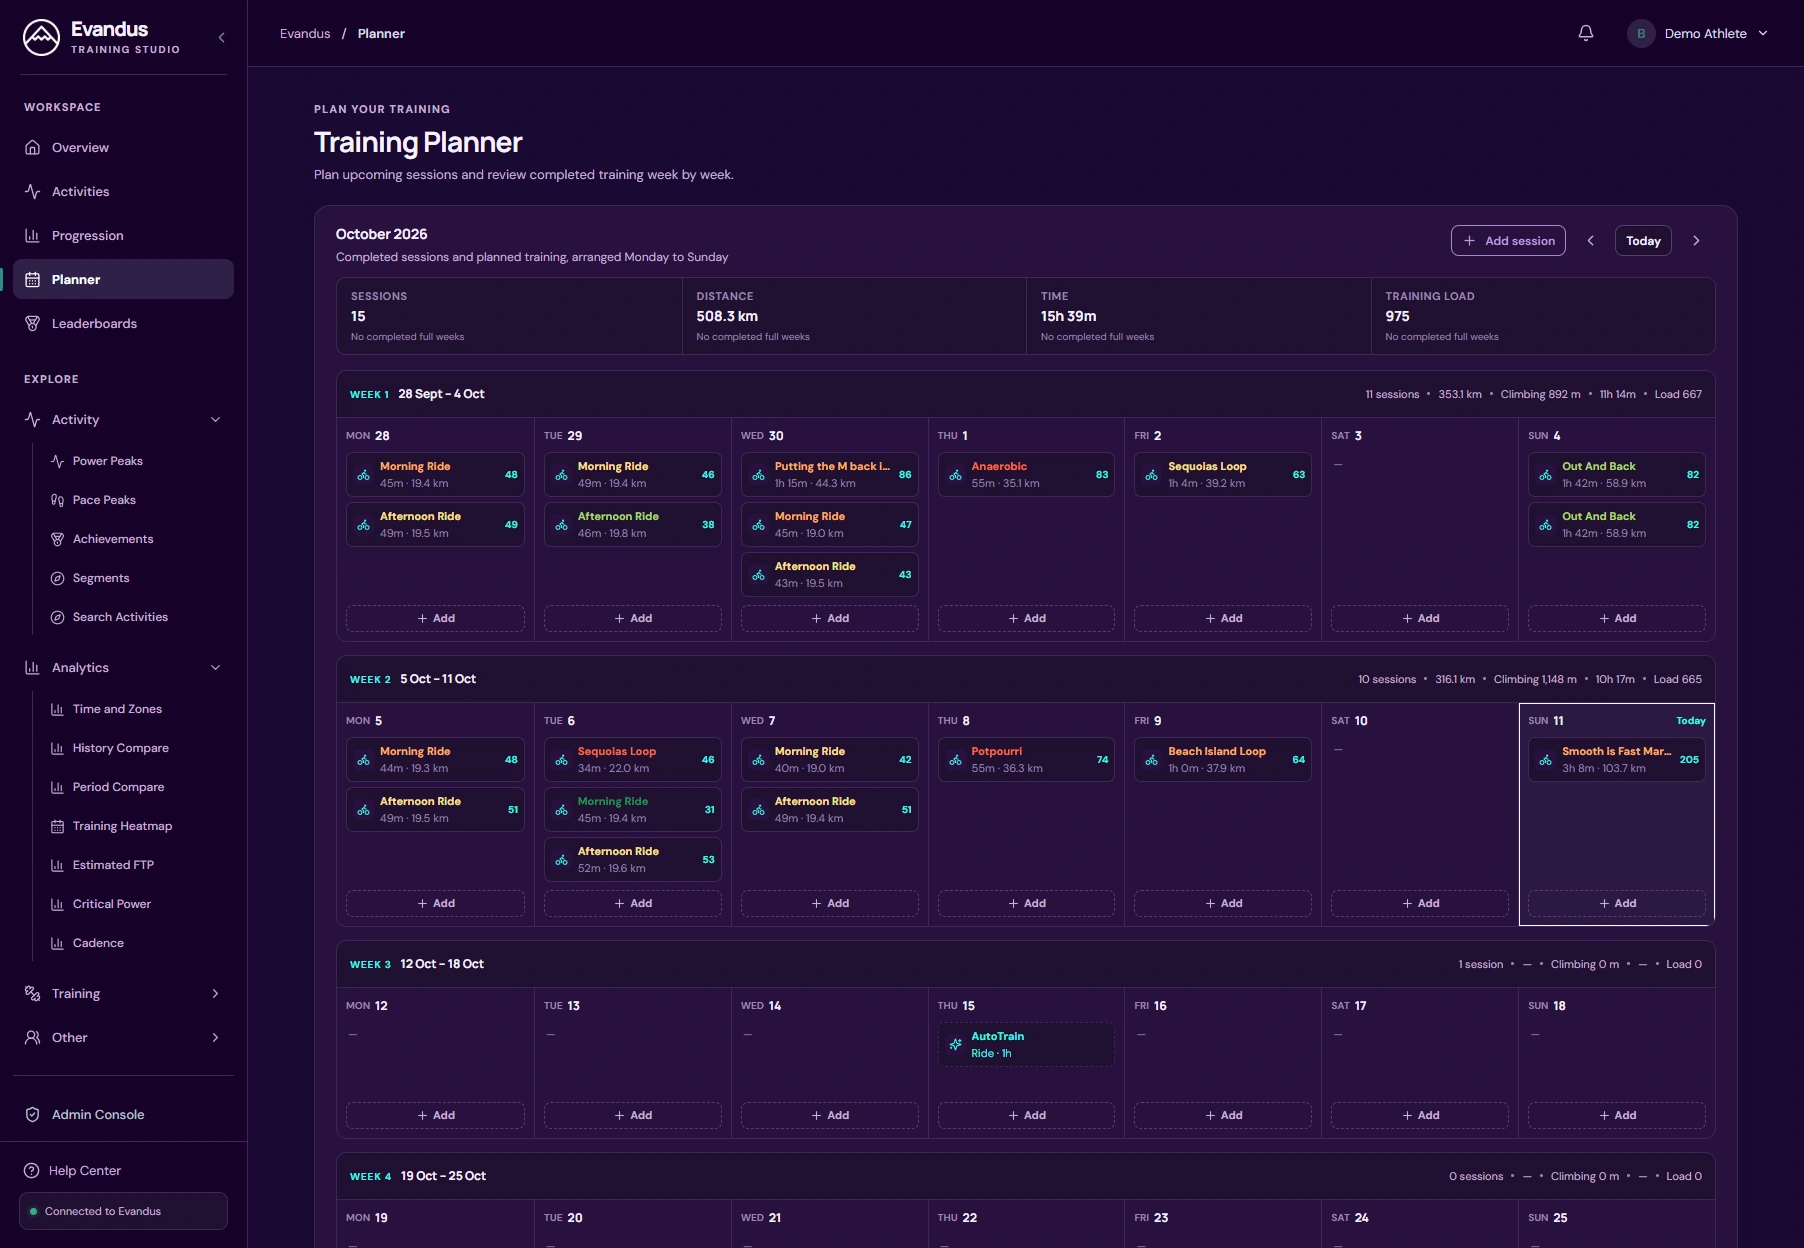
The calendar provides a view of your activities on a monthly basis. There is also the ability to plan future events by clicking on future days. Future events you can track towards a time or load per week goal. As days complete they will color green for following the plan, orange for partial following and red for no following.
Click the icon on the desktop for detailed usage guidelines.
On the mobile calendar view further feedback on your weekly load tracking is provided.
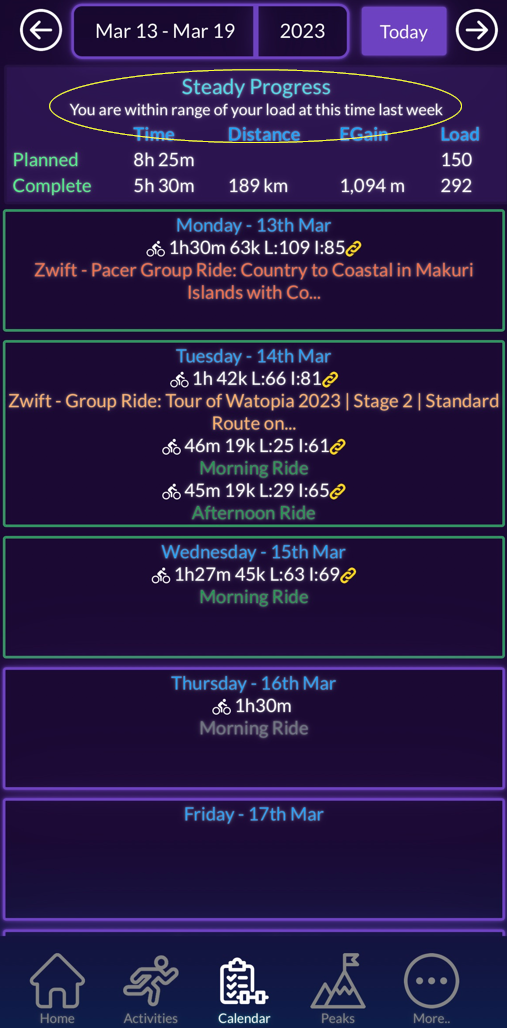
Weekly Cycle Tracking
Use the 'Weekly Cycle Target' command to setup a weekly cycle to suggest when a rest week should occur on the home screen. Optionally set zone distribution targets based on time.
History Compare
Use the 'History Compare' command to see yearly totals across activities and your peaks recorded.
Estimated FTP
Use the 'Estimated FTP' command to see a calculated FTP based on your recent best efforts. Your efforts across 5/12/20/60 minutes are used to measure this.
Smart Workout Selection
Use the 'Autotrain' command to provide suggested cycling workouts based on your training ability and current tiredness.
These workout are available inside Zwift or can be downloaded into other platforms. Use the desktop version of the command to download them via this link  . Note you can see all workouts with the 'Workout Search' command.
Calendar based Smart Workout Selection
Take the thinking out of workout selection by planning a cycling workout in the calendar with 'AutoTrain'.
The platform will pick an appropriate workout for your level and workouts can be selected from the full Zwift workout library.